Frogegg Model Walkthrough
This page presents a detailed walkthrough on how to use the JigCell software to examine and execute the basic Frogegg model. For details on the model itself, and to gain an understanding of how a modeler would use JigCell, see the Frogegg Model Usecase.
This walkthrough description assumes that you are running JigCell on a Linux machine. Windows users will operate JigCell in the same way as described here, except that some of the startup procedures are different. At this time, we do not support the parameter estimator on Windows.
JigCell relies on the Open Agent Architecture protocol for communications between its simulators and the Run Manager. Thus, an OAA facilitator must be running, as well as the simulator clients' OAA interfaces. The first thing that a user needs to do before starting JigCell proper is to get some of the background communications started. You can do so with the following steps:
- cd to the JigCell home directory (normally this is named JigCell in your home directory).
- If necessary, edit setup.pl to tell JigCell where to find the facilitator. Unless you know better, this will be your current machine, and the JigCell installer should have set this for you by default.
- Run facilitator/fac_linux.
- Run xppserver.sh.
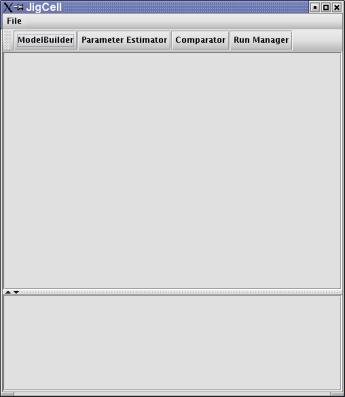
Now you are ready to start JigCell. We will do this by invoking the Project Manager. To do this, run projectmanager.sh. You will see a popup like this:
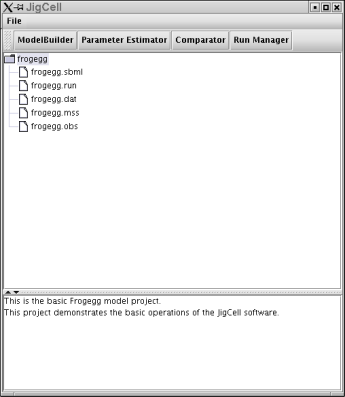
Now you will open the Frogegg project, which has already been created. The purpose of a project is to put together in one place all of the files needed as part of a logical "project". To open an existing project, click on the "File" menu, then on "Open Project". In the resulting popup, open on the "frogegg" directory by double-clicking on the folder icon or the name "frogegg". In the resulting popup, click on "frogegg.proj" and then click the "Open" at the lower right corner of the window. As a result, you should see the following in your Project Manager screen.
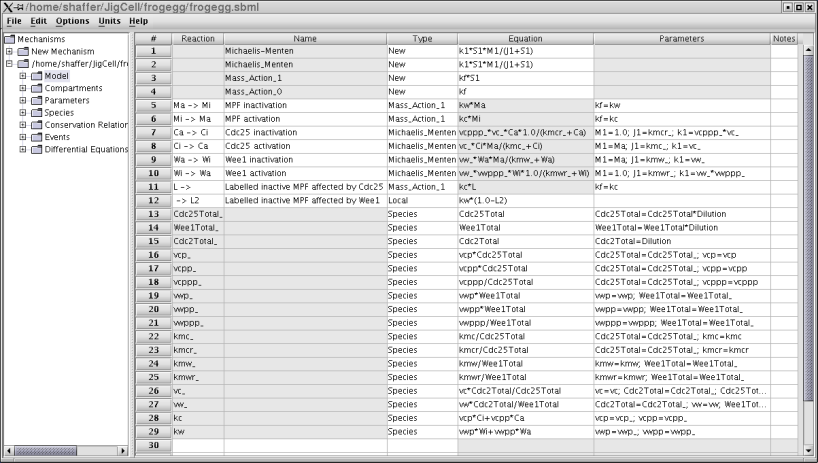
Now you will examine the Frogegg model. By "model" we mean a set of reaction equations, paramters, and initial conditions. The Model Builder is a tool for creating and editing models. To open the Frogegg model, LEFT click on the line that says "frogegg.sbml" in the main Project Manager window to select it, and then RIGHT click on that line to bring up the action menu. Slide the cursor down to the item that says "Open file in...", and follow the arrow to "Model Builder". You can right or left click on "Model Builder" to open the file. Wait several seconds for the Model Builder to open and read in the model file. You should then see the following window on your screen:
To see a list of model parameters and their initial conditions, click on "Parameters" in the left tree view to get the following window:
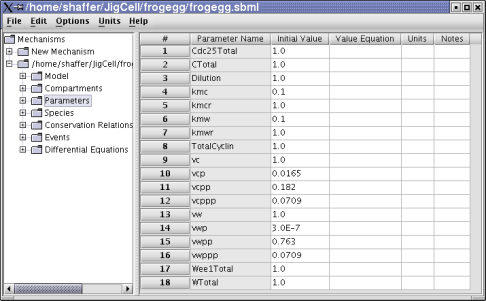
We can see more initial conditions by clicking on "Species" to get the following window:
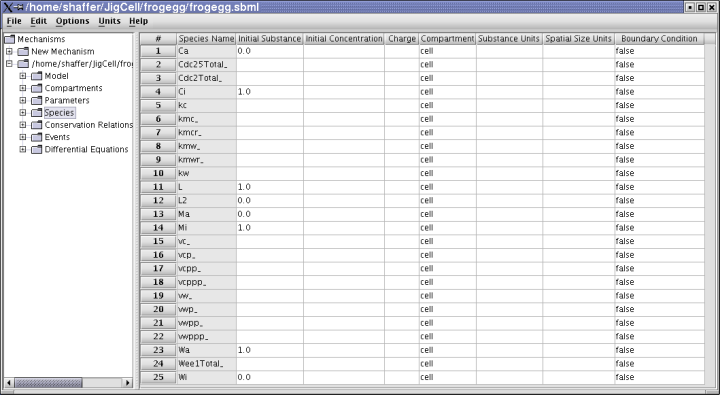
Given the basic model in terms of its reaction equations and initial conditions, the next step is to define the operational behavior of the model. By this we mean a collection of simulations that will be run, and the various parameter values that will be assocated with each of the runs. This information is defined in the JigCell Run Manager.
Close the Model Builder by clicking on the "File" menu and then on "Exit". In the Project Manger window, open the run manager on a run file by LEFT clicking on the line that says "frogegg.run" to select it, then RIGHT clicking to bring up its action menu. Move the mouse over the "Open file in..." item on the menu, and slide the mouse over the arrow to open the "Run Manager" item. Open the Run Manager by left or right clicking on this line. Wait a few seconds for the run manager to load, to get the following window.
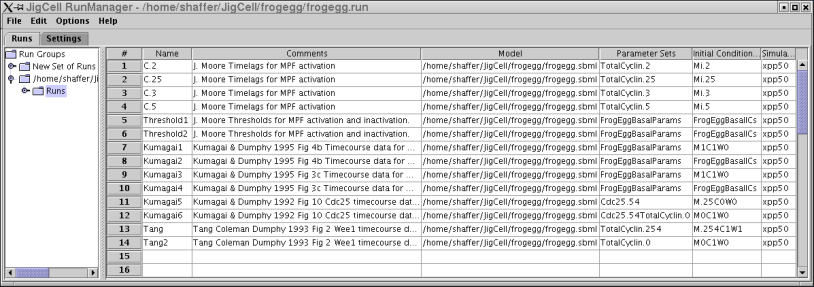
This screen shows that we will make 14 simulation runs. Each run has a name (the "name" column) and some comments that describe where the information comes from. The particular SBML file to be used by this simulation is indicated in the "Model" column. The specific parameter and initial condition values used by a given simulator run may be viewed by clicking on the appropriate cell in the Run Manager spreadsheet. Doing so will pop up an editor fo the paramter set or initial condition values. For example, clicking on "TotalCyclin.5" in the "Parameter Sets" column of the fourth row will show the following editor screen.

The run manager just lets us define how to execute simulations, it doesn't actually let us do the execution, nor set them in context of comparing the outputs of the simulations versus the expected results as determined by experiments in the lab. To run the simulations and evaluate their quality, we use the JigCell Comparator. Now we will close the Run Manager by clicking on the "File" menu and then "Exit". From the Project Manager screen, click on the button in the middle near the top labeled "Comparator". It will take a moment or so to load, and then you should see the following screen.
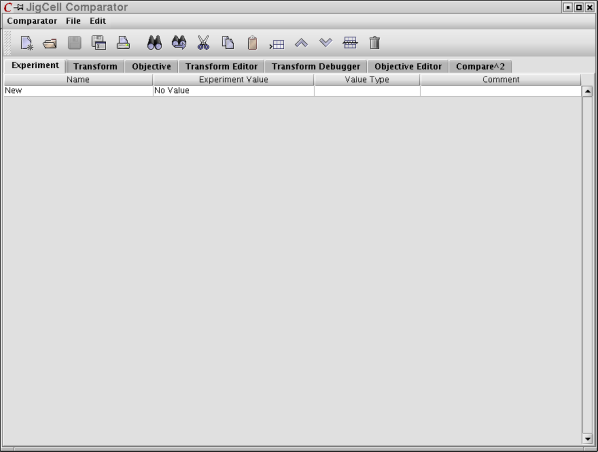
You must now load three sets of information into the comparator. The first is the experimental data. That is, the information obtained from laboratory experiments against which the simulation results are to be measured. Click on the "Experiment" tab, then on the "File" menu, and "Open". In the popup file selector window, double-click on "frogegg", then "frogegg.dat" to generate the following screen.
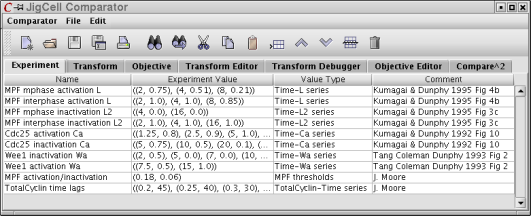
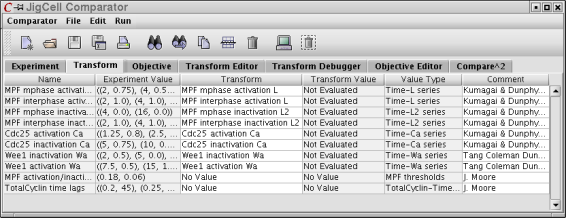
This loads up 10 lines of information related to various experiments. The next step is to load definitions for how to convert simulation output to values that can be matched against the simulation results. Click on the "Transform" tab, then the "File" menu and the "Open" menu item. In the resulting popup file selector, double-click on "frogegg" and then double-click on "frogegg.mss" to generate the following window.
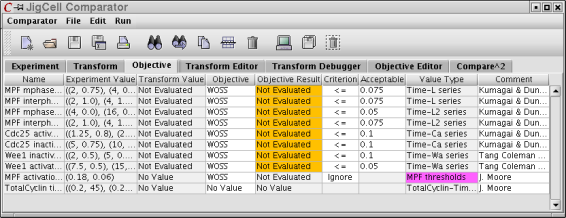
The last step is to load up the definition for how the objective functions for doing the actual comparison between simulation and experimental results. Click on the "Objective" tab, then the "File" menu and the "Open" item. In the popup file browser, double-click on "frogegg" and then on "frogegg.obs" to yield the following screen.
We are now ready to run a series of simulations. Click on the "Run" menu at the top of the Comparator window, and then on the "Run" item. You should get a popup progress indicator bar. After a couple of minutes, you should see the following results in the Comparator window.
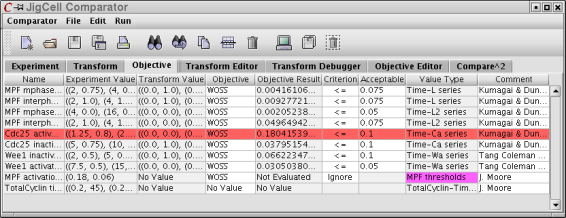
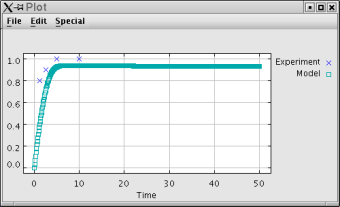
These results indicate that the 5th simulation gave unacceptable results, that the remainder of the top 8 simulations were acceptable, and that the last two lines were not actually run. You can see a plot of the simulation results by right-clicking a row in the comparator window and clicking on "Plot" in the resulting popup menu. Doing so on the red-colored row will yield the following graph.
